

Analytics & Performance Guide
Monitor how shoppers interact with your recommendation widgets directly from your Cubic Carousel dashboard.
1. Key Performance Indicators (KPIs)
Section titled “1. Key Performance Indicators (KPIs)”The Analytics dashboard tracks two core metrics aggregated from your storefront:
- Total Carousel Clicks: The total number of customer clicks on product recommendation cards across floating bars, sliders, and grids.
- Unique Products Discovered: The number of distinct catalog products shoppers discovered and clicked through Cubic Carousel.
2. Analytics Plan Tiers
Section titled “2. Analytics Plan Tiers”| Plan Tier | Analytics Retention & Access |
|---|---|
| Starter Plan | Analytics dashboard is disabled. |
| Growth Plan | Click engagement metrics tracked and displayed for the last 30 days. |
| Pro Plan | Unlocks full, unrestricted All-Time historical tracking and deep logs. |
3. Real-Time Tracking Logs
Section titled “3. Real-Time Tracking Logs”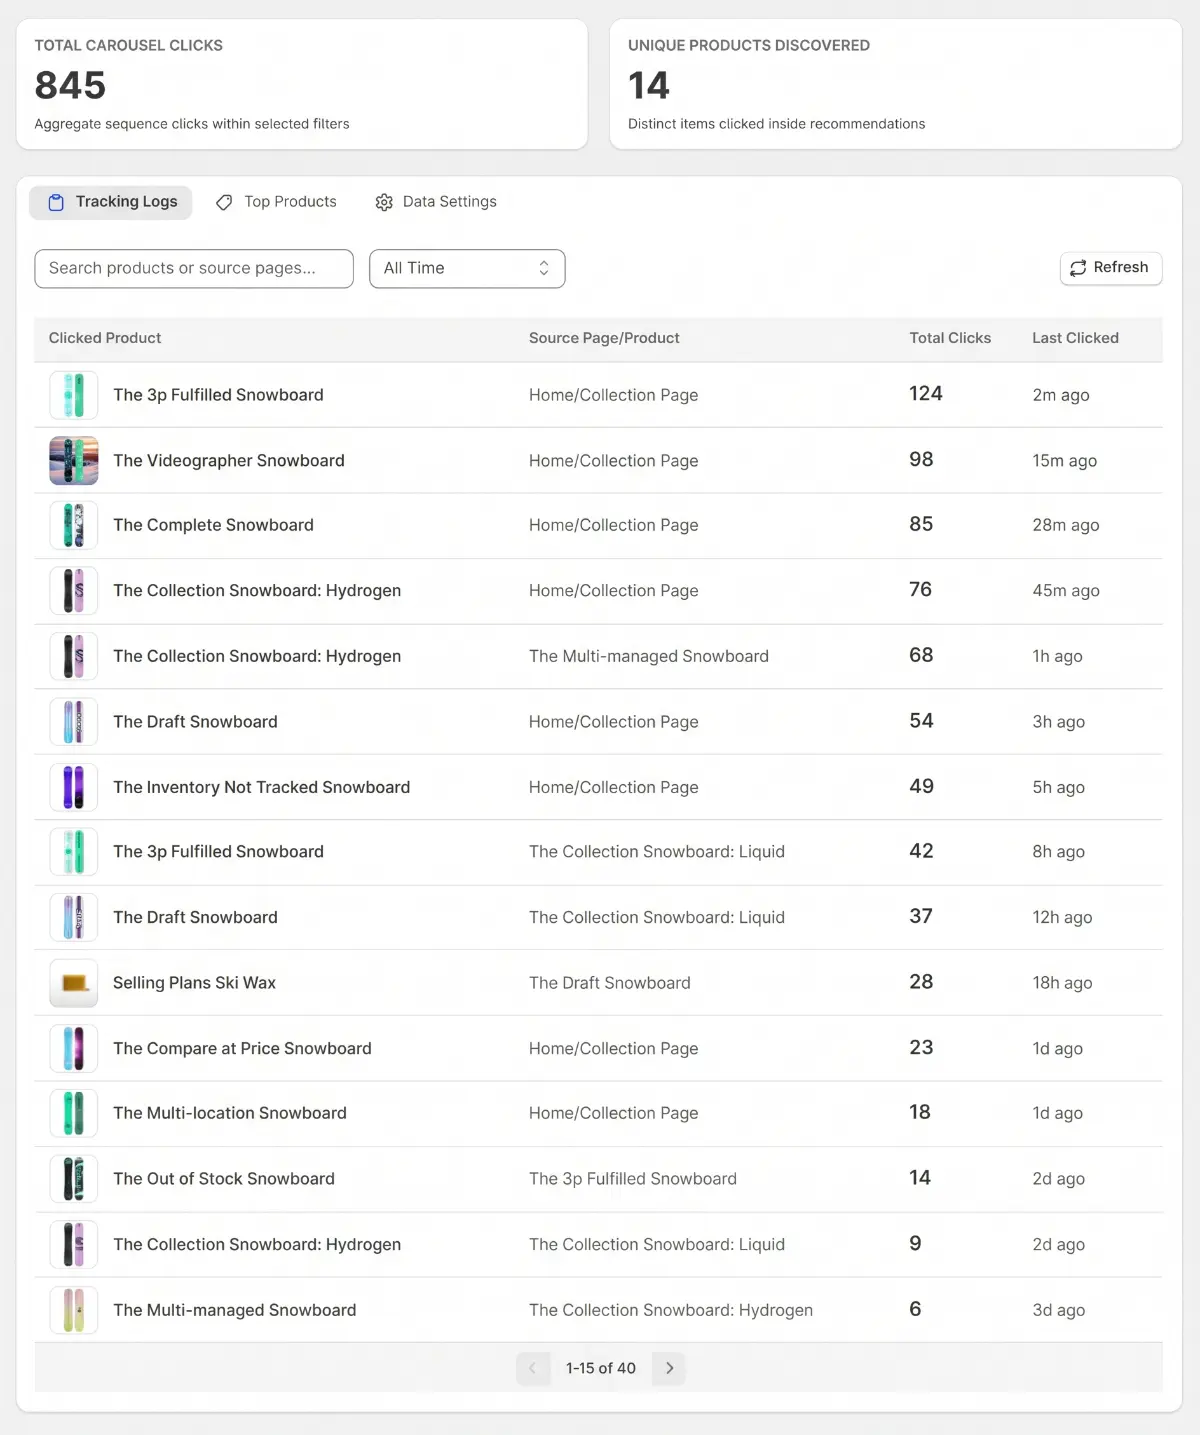
Under the Tracking Logs tab in your admin dashboard, you can search and inspect individual click events as they happen:
- Filter by product title or product ID.
- Inspect timestamp, referer URL, and recommendation source strategy that drove the click.
- Zero privacy impact: Tracking measures product interaction counts without storing customer PII.
4. Top Converting Products
Section titled “4. Top Converting Products”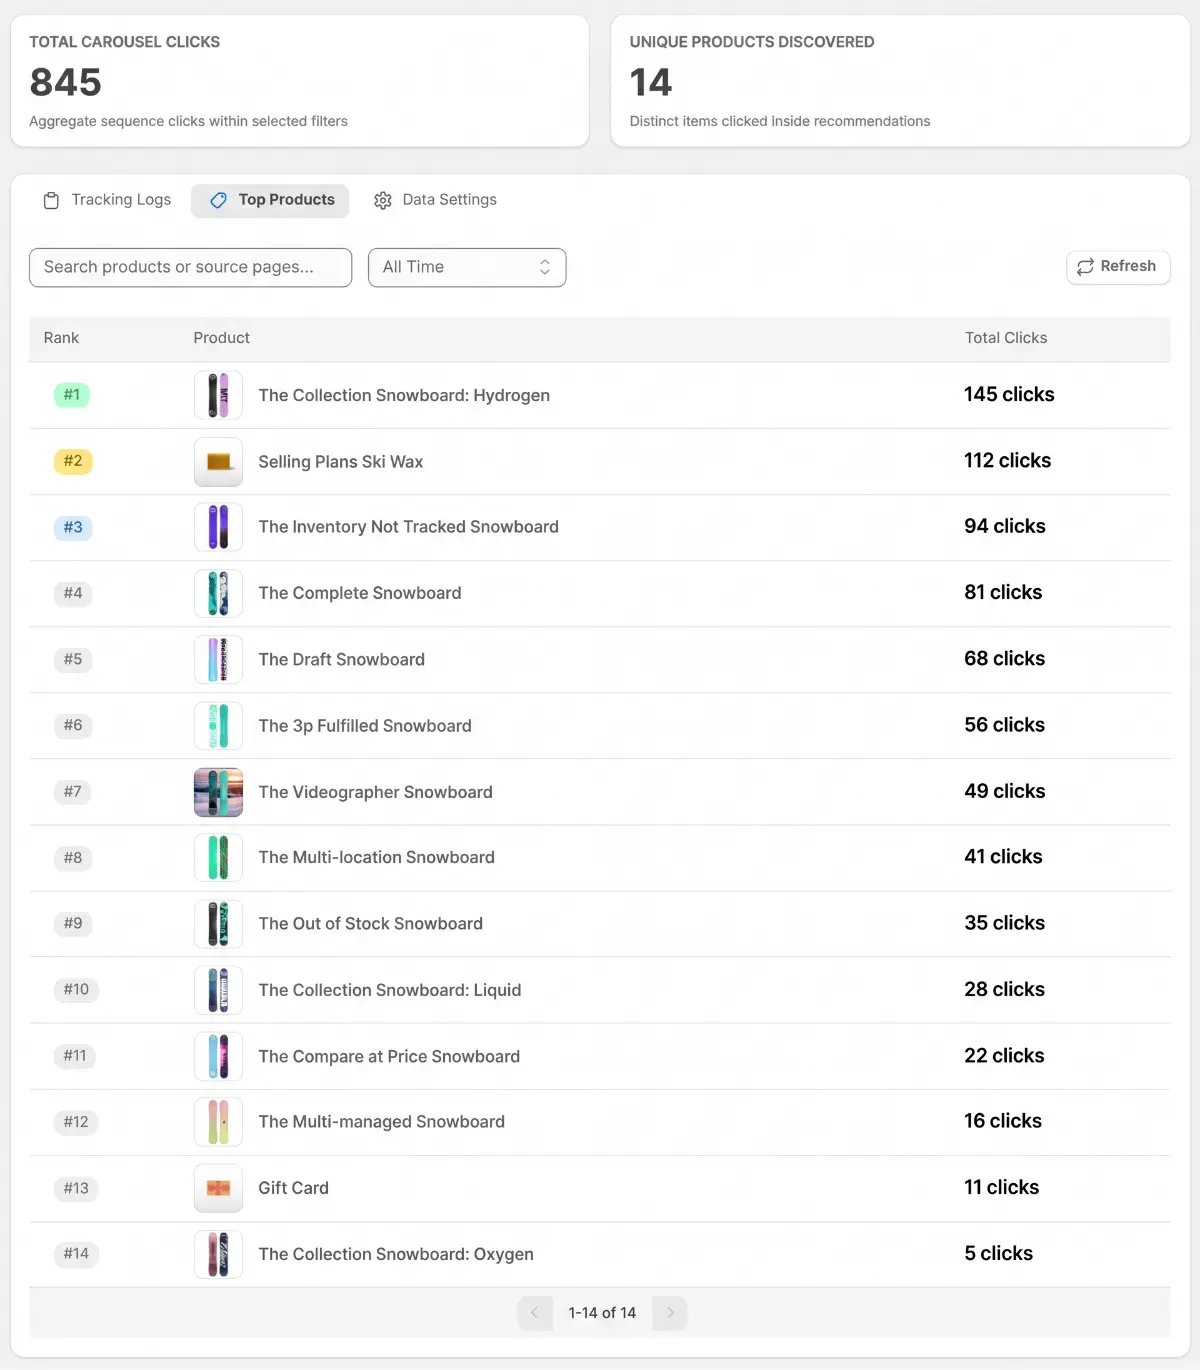
Identify your highest-performing catalog items at a glance:
- Track total click count and percentage share per product.
- Direct link to your live product pages to inspect conversion health.
- See which recommendation strategies generate the highest engagement.